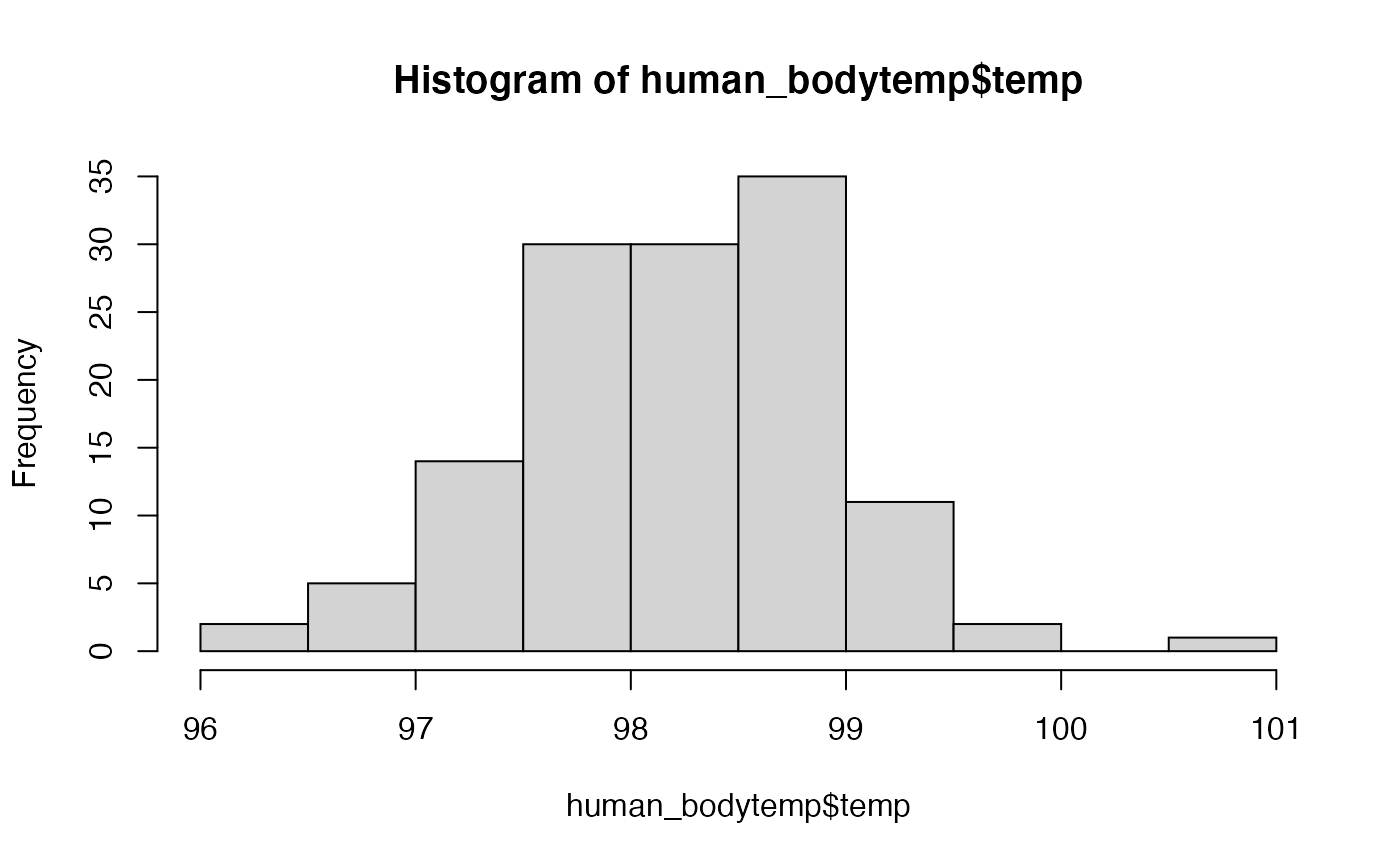
Human body temperature data and heartrate
human_bodytemp.RdPhysiology data originally from Mackowiak et al (1992). Developed as a demonstration for t-tests by Shoemaker (1996) and also used by Motulsky (2014).
human_bodytemp
Format
A data frame with 2 columns:
- temp
body temperature in degrees F
- sex
sex of individual
- heartrate
heartrate in beats per minute
Source
https://www.fws.gov/midwestgle/population/nos_state_tbl.html
http://www.media.pa.gov/pages/Game-Commission-Details.aspx?newsid=44
References
Mackowiak et al. 1992. A critical appraisal of 98.6 F, the upper limit of the normal body temperature, and Other legacies of Carl Reinhold August Wunderlich. JAMA. 268:1578-1580. https://jamanetwork.com/journals/jama/article-abstract/400116
Motulsky, H. 2014. Intuitive biostatistics: a nonmathematical guide to statistical thinking.
Shoemaker, A. 1996. What's Normal? -- Temperature, Gender, and Heart Rate. Journal of Statistics Education v.4, n.2. ww2.amstat.org/publications/jse/v4n2/datasets.shoemaker.html
