5 D
5.1 Talking Glossary: Deletion mutation (1.5 min)
https://www.genome.gov/genetics-glossary/Deletion
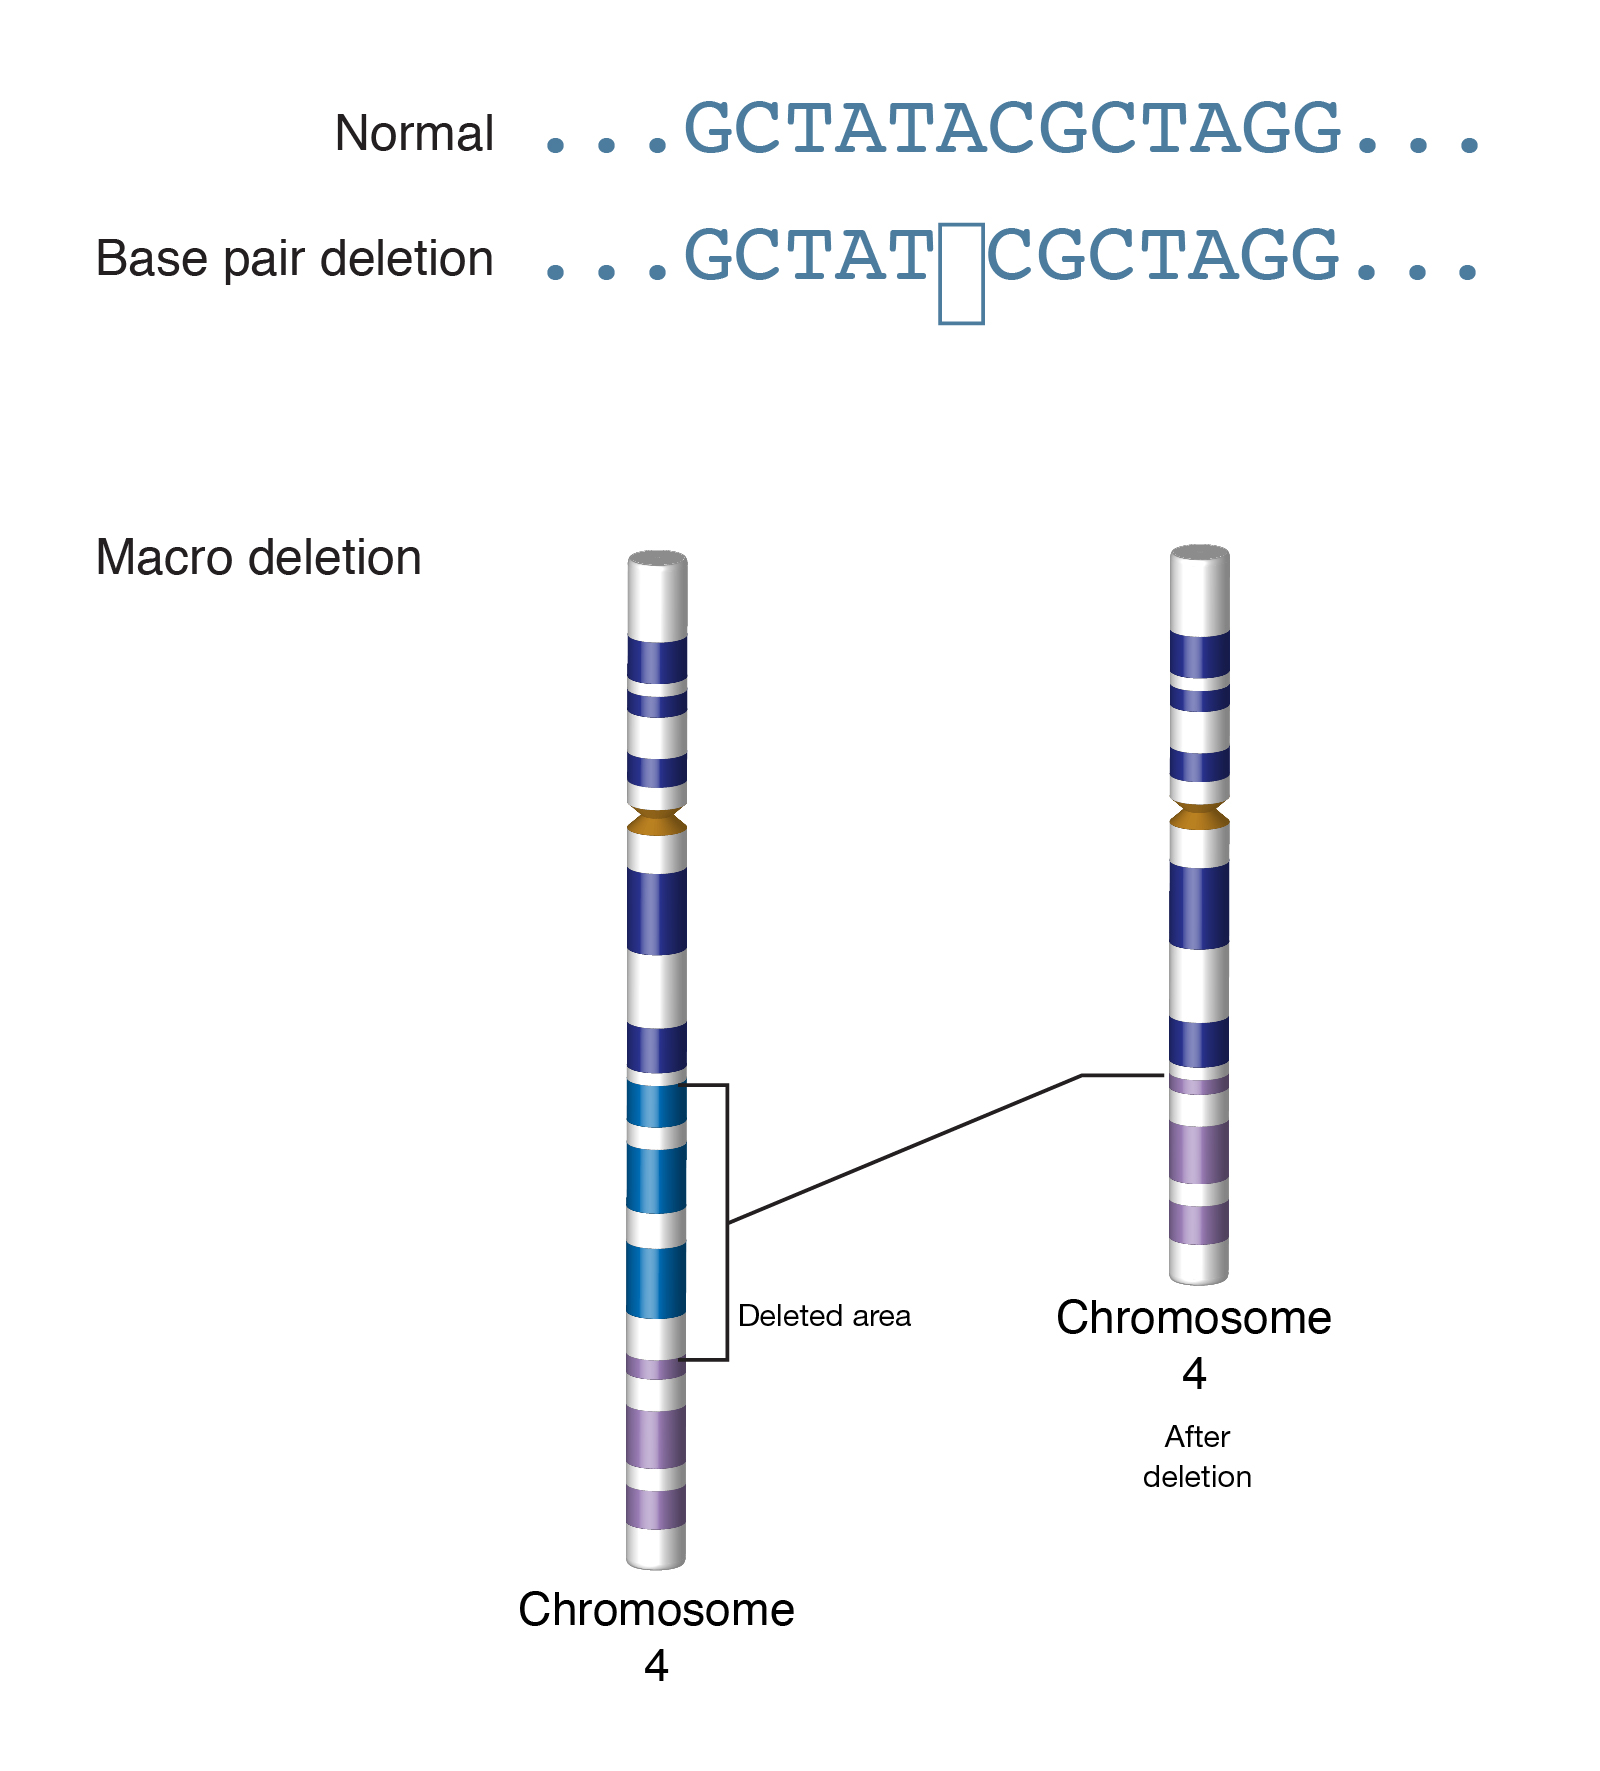
Abstract: “Deletion is a type of mutation involving the loss of genetic material. It can be small, involving a single missing DNA base pair, or large, involving a piece of a chromosome.”
Note: Among evolutionary biologists, “deletion” usually means deletion of a single base; larger deletions are specified, e.g. “chromosomal deletion.” In order to recognize a deletion, there’s needs to be some frame of reference, such as a consensus sequence, a reference genomic sequence, or other individuals in a multiple sequence alignment (MSA). Deletions of all sizes can be useful for constructing phylogenies.
Image: https://www.genome.gov/sites/default/files/tg/en/illustration/deletion.jpg Example of single base and chromosomal deletion.
Transcript: “Deletion really means that something is missing. And as a geneticist talking about deletion it means something is missing of the genetic material. And it can be something small, just a base pair; it can be something larger; it can be part of a gene; it can be even larger; it can be an entire gene; or yet larger again, it can be part of the chromosome. And depending upon what it is, you have to look at it in different ways. You can find a deletion in a chromosome just by doing a cytogenetic or chromosome analysis, or a deletion in a gene you can find out by sequencing the DNA. So when you have a deletion, depending upon the size, it can have different effects. What was the most surprising to me was that just by having a deletion of one base pair, you can have the most severe birth defect, and sometimes by missing an entire chromosome, you don’t even see all that much compared to just having a deletion of a small base pair. Different deletions can lead to different findings, and they can affect just behavior; they can affect how a child, how a person looks; they can affect a very severe problem that the child may die at birth; or they can affect something that just has to do with eye color, hair color, with weight or height of the person.”
Maximilian Muenke, M.D.
5.2 Talking Glossary: DNA sequencing (0.75 min)
Introduction: “DNA sequencing is a laboratory technique used to determine the exact sequence of bases (A, C, G, and T) in a DNA molecule. The DNA base sequence carries the information a cell needs to assemble protein and RNA molecules. DNA sequence information is important to scientists investigating the functions of genes. The technology of DNA sequencing was made faster and less expensive as a part of the Human Genome Project.”
Transcript: “DNA consists of a linear string of nucleotides, or bases, for simplicity, referred to by the first letters of their chemical names–A, T, C and G. The process of deducing the order of nucleotides in DNA is called DNA sequencing. Since the DNA sequence confers information that the cell uses to make RNA molecules and proteins, establishing the sequence of DNA is key for understanding how genomes work. The technology for DNA sequencing was made faster and less expensive as a part of the Human Genome Project. And recent developments have profoundly increased the efficiency of DNA sequencing even further.”
Eric D. Green, M.D., Ph.D.
5.3 Sex-Chromosome Dosage compensation
Dosage compensation is the process by which organisms equalize the expression of genes between individuals with different sex chromosome karyotypes (e.g. XX versus XY). Across species, different “sexes” are often characterized by different types and numbers of sex chromosomes . In order to neutralize the large difference in gene dosage produced by differing numbers of sex chromosomes, various evolutionary branches have acquired various methods to equalize gene expression . Because sex chromosomes contain different numbers of genes , different species of organisms have developed different mechanisms to cope with this inequality. Replicating the actual gene is impossible; thus organisms instead equalize the expression from each gene. For example, in humans , XX individuals silence the transcription of one X chromosome of each pair, and transcribe all information from the other, expressed X chromosome. Thus, human XX individuals have the same number of expressed X-linked genes as do human XY individuals, with both having essentially one X chromosome per cell, from which to transcribe and express genes. This is called X-inactivation. In each XX cell, one of the two X chromosomes is randomly inactivated.
Other lineages have evolved different mechanisms to cope with the differences in gene copy numbers between the sexes that are observed on sex chromosomes. Some lineages have evolved upregulation mechanisms which restores expression of X-specific genes in the heterogametic sex (e.g. XY) to the same levels observed in the ancestor prior to the evolution of the sex chromosome.
5.3.1 Random inactivation of one X in XX individuals
One logical way to equalize gene expression amongst XX and XY that follow a XX/XY sex differentiation scheme would be to decrease or altogether eliminate the expression of one of the X chromosomes in an XX, (homogametic) individual, such that both XX and XY individuals express only one X chromosome. This is the case in many mammalian organisms, including humans and mice.[1 This process involves histone tail modifications, DNA methylation patterns, and reorganization of large-scale chromatin structure. In spite of these extensive modifications, not all genes along the X chromosome are subject to X-inactivation.] Because so many variants are tested, it is standard practice to require the p-value to be lower than 5×10⁻⁸ to consider a variant significant.
There are several variations to this case-control approach. A common alternative to case-control GWAS is the analysis of quantitative phenotypic data, e.g. height or biomarker concentrations or even gene expression. Likewise, alternative statistics designed for dominance or recessive penetrance patterns can be used (16] Calculations are typically done using bioinformatics software such as SNPTEST and PLINK, which also include support for many of these alternative statistics (15, 17). GWAS focuses on the effect of individual SNPs. However, it is also possible that complex interactions among two or more SNPs (epistasis) might contribute to complex diseases. Due to the potentially exponential number of interactions, detecting statistically significant interactions in GWAS data is both computationally and statistically challenging. This task has been tackled in existing publications that use algorithms inspired from data mining (18) Moreover, the researchers try to integrate GWA data with other biological data such as protein-protein interaction network to extract more informative results (19, 20).
In addition to the calculation of association, it is common to take into account any variables that could potentially confound the results. Sex and age are common examples of confounding variables. Moreover, it is also known that many genetic variations are associated with the geographical and historical populations in which the mutations first arose (25). Because of this association, studies must take account of the geographic and ethnic background of participants by controlling for what is called population stratification. If they fail to do so, these studies can produce false positive results (26)
After odds ratios and P-values have been calculated for all SNPs, a common approach is to create a Manhattan plot. In the context of GWAS, this plot shows the negative logarithm of the P-value as a function of genomic location. Thus the SNPs with the most significant association stand out on the plot, usually as stacks of points because of haploblock structure. Importantly, the P-value threshold for significance is corrected for multiple testing issues. The exact threshold varies by study,[27] but the conventional threshold is 5×10⁻⁸ to be significant in the face of hundreds of thousands to millions of tested SNPs (7, 16, 28] GWAS typically perform the first analysis in a discovery cohort, followed by validation of the most significant SNPs in an independent validation cohort (29]
5.3.2 Results
An early GWAS, conducted in 2005, compared 96 patients with the eye disorder age-related macular degeneration (ARMD) with 50 healthy controls (33). It identified two SNPs with significantly altered allele frequencies between the two groups. These SNPs were located in the gene encoding complement factor H, which was an unexpected finding in the research of ARMD. These findings prompted further functional research towards therapeutical manipulation of the complement system in ARMD (34). Another landmark publication in the history of GWAS was the Wellcome Trust Case Control Consortium (WTCCC) study, the largest GWAS ever conducted at the time of its publication in 2007. The WTCCC included 14,000 cases of seven common diseases (~2,000 individuals for each of coronary heart disease, type 1 diabetes, type 2 diabetes, rheumatoid arthritis, Crohn’s disease, bipolar disorder, and hypertension) and 3,000 shared controls (15). This study was successful in uncovering many new disease genes underlying these diseases (15, 35).
Since these first landmark GWAS, there have been two general trends (36). One has been towards larger and larger sample sizes. In 2018, several genome-wide association studies are reaching a total sample size of over 1 million participants, including a study of insomnia containing 1.3 million individuals (38). The reason is the drive towards reliably detecting risk-SNPs that have ever smaller effects and lower allele frequencies. Another trend has been towards the use of more narrowly defined continous phenotypes, such as concentrations of blood lipids, proinsulin or similar biomarkers (39, 40). These are called intermediate phenotypes, and their analyses may be of value to functional research into biomarkers (41).
A central point of debate on GWAS has been that most of the SNP variations found by GWAS are associated with only a small increased risk of the disease, and have only a small predictive value.
The effects sizes are considered small because they do not explain much of the heritable variation. This heritable variation is estimated from heritability studies based on monozygotic twins (44). For example, it is known that 80-90% of variance in height can be explained by hereditary differences, but GWAS only account for a minority of this variance (44). This is sometimes referred to as the problem of the missing heritability of GWAS.
5.3.3 Clinical applications
THIS SECTION IS OPTIONAL
A challenge for future successful GWAS is to apply the findings in a way that accelerates drug and diagnostics development, including better integration of genetic studies into the drug-development process and a focus on the role of genetic variation in maintaining health as a blueprint for designing new drugs and diagnostics (45). Several studies have looked into the use of risk-SNP markers as a means of directly improving the accuracy of prognosis. Some have found that the accuracy of prognosis improves (46), while others report only minor benefits from this use (47). Generally, a problem with this direct approach is the small magnitudes of the effects observed. A small effect ultimately translates into a poor separation of cases and controls and thus only a small improvement of prognosis accuracy. An alternative application is therefore the potential for GWAS to elucidate pathophysiology (48).
One such success is related to identifying the genetic variant associated with response to anti-hepatitis C virus treatment. For genotype 1 hepatitis C treated with Pegylated interferon-alpha-2a or Pegylated interferon-alpha-2b combined with ribavirin, a GWAS (49) has shown that SNPs near the human IL28B gene, encoding interferon lambda 3, are associated with significant differences in response to the treatment. A later report demonstrated that the same genetic variants are also associated with the natural clearance of the genotype 1 hepatitis C virus (50). These major findings facilitated the development of personalized medicine and allowed physicians to customize medical decisions based on the patient’s genotype (51).
The goal of elucidating pathophysiology has also led to increased interest in the association between risk-SNPs and the gene expression of nearby genes, the so-called expression quantitative trait loci (eQTL) studies (52). The reason is that GWAS studies identify risk-SNPs, but not risk-genes, and specification of genes is one step closer towards actionable drug targets. As a result, major GWAS by 2011 typically included extensive eQTL analysis (53, 54, 55). One of the strongest eQTL effects observed for a GWA-identified risk SNP is the SORT1 locus (39). Functional follow up studies of this locus using small interfering RNA and gene knock-out mice have shed light on the metabolism of low-density lipoproteins, which have important clinical implications for cardiovascular disease (39, 56, 57).
5.3.3.1 Atrial fibrillation
This section is optional
For example, a meta-analysis accomplished in 2018 revealed the discovery of 70 new loci associated with atrial fibrillation. It has been identified different variants associated with transcription factor coding-genes, such as TBX3 and TBX5, NKX2-5 o PITX2, which are involved in cardiac conduction regulation, in ionic channel modulation and cardiac development. It was also identified new genes involved in tachycardia (CASQ2) or associated with alteration of cardiac muscle cell communication (PKP2) (58)
5.3.3.2 Schizophrenia
This section is optional
While there is some research using a High-Precision Protein Interaction Prediction (HiPPIP) computational model that discovered 504 new protein-protein interactions (PPIs) associated with genes linked to schizophrenia (59,60) the evidence supporting the genetic basis of schizophrenia is actually controversial and may suffer from some of the limitation of this method of study (61]
5.3.4 Agricultural applications
5.3.4.1 Plant growth stages and yield components
This section is optional
GWAS act as an important tool in plant breeding. With large genotyping and phenotyping data, GWAS are powerful in analyzing complex inheritance modes of traits that are important yield components such as number of grains per spike, weight of each grain and plant structure. In a study on GWAS in spring wheat, GWAS have revealed a strong correlation of grain production with booting data, biomass and number of grains per spike (62).
5.3.4.2 Plant pathogens
This section is optional
The emergences of plant pathogens have posed serious threats to plant health and biodiversity. Under this consideration, identification of wild types that have the natural resistance to certain pathogens could be of vital importance. Furthermore, we need to predict which alleles are associated with the resistance. GWAS is a powerful tool to detect the relationships of certain variants and the resistance to the plant pathogen, which is beneficial for developing new pathogen-resisted cultivars (63).
5.3.5 Limitations
5.3.5.1 Limitations - common errors
This section is optional
GWAS have several issues and limitations that can be taken care of through proper quality control and study setup. Lack of well defined case and control groups, insufficient sample size, control for multiple testing and control for population stratification are common problems (2). Particularly the statistical issue of multiple testing wherein it has been noted that “the GWA approach can be problematic because the massive number of statistical tests performed presents an unprecedented potential for false-positive results” (2). Ignoring these correctible issues has been cited as contributing to a general sense of problems with the GWAS methodology (64). In addition to easily correctible problems such as these, some more subtle but important issues have surfaced. A high-profile GWA study that investigated individuals with very long life spans to identify SNPs associated with longevity is an example of this (65). The publication came under scrutiny because of a discrepancy between the type of genotyping array in the case and control group, which caused several SNPs to be falsely highlighted as associated with longevity (66). The study was subsequently retracted (67), but a modified manuscript was later published (68).
5.3.5.2 Limitations - fundamental problems (READ THIS ECTION)
READ THIS SECTION
The fundamental assumptions of GWAS and have attracted fundamental criticism, mainly because of their assumption that common genetic variation plays a large role in explaining the heritable variation of common disease (69). Indeed, it has been estimated that for most conditions the SNP heritability attributable to common SNPs is <0.05 (70). This aspect of GWAS has attracted the criticism that, although it could not have been known prospectively, GWAS were ultimately not worth the expenditure (48). GWAS also face criticism that the broad variation of individual responses or compensatory mechanisms to a disease state cancel out and mask potential genes or causal variants associated with the disease (71). Additionally, GWAS identify candidate risk variants for the population from which their analysis is performed, and with most GWAS stemming from European databases, there is a lack of translation of the identified risk variants to other non-European populations (72] Alternative strategies suggested involve linkage analysis (73, 74] More recently, the rapidly decreasing price of complete genome sequencing have also provided a realistic alternative to genotyping array-based GWAS. It can be discussed if the use of this new technique is still referred to as a GWA study, but high-throughput sequencing does have potential to side-step some of the shortcomings of non-sequencing GWA (75]
5.4 Fine-mapping
THIS SECTION IS OPTIONAL
Genotyping arrays designed for GWAS rely on linkage disequilibrium to provide coverage of the entire genome by genotyping a subset of variants. Because of this, the reported associated variants are unlikely to be the actual causal variants. Associated regions can contain hundreds of variants spanning large regions and encompassing many different genes, making the biological interpretation of GWAS loci more difficult. Fine-mapping is a process to refine these lists of associated variants to a credible set most likely to include the causal variant.
Fine-mapping requires all variants in the associated region to have been genotyped or imputed (dense coverage), very stringent quality control resulting in high-quality genotypes, and large sample sizes sufficient in separating out highly correlated signals. There are several different methods to perform fine-mapping, and all methods produce a posterior probability that a variant in that locus is causal. Because the requirements are often difficult to satisfy, there are still limited examples of these methods being more generally applied.