Chapter 8 Plotting vectors in base R
By: Avril Coghlan
Adapted, edited and expanded: Nathan Brouwer (brouwern@gmail.com) under the Creative Commons 3.0 Attribution License (CC BY 3.0).
8.1 Preface
This is a modification of part of“DNA Sequence Statistics (2)” from Avril Coghlan’s A little book of R for bioinformatics.. Most of text and code was originally written by Dr. Coghlan and distributed under the Creative Commons 3.0 license.
8.2 Plotting numeric data
R allows the production of a variety of plots, including scatterplots, histograms, piecharts, and boxplots. Usually we make plots from dataframes with 2 or more columns, but we can also make them from two separate vectors. This flexibility is useful, but also can cause some confusion.
For example, if you have two equal-length vectors of numbers numeric.vect1 and numeric.vect1, you can plot a scatterplot of the values in myvector1 against the values in myvector2 using the base R plot()function.
First, let’s make up some data in put it in vectors:
numeric.vect1 <- c(10, 15,  22,  35,  43)
numeric.vect2 <- c(3,  3.2, 3.9, 4.1, 5.2)
Not plot with the base R plot() function:
plot(numeric.vect1, numeric.vect2)
Note that there is a comma between the two vector names. When building plots from dataframes you usually see a tilde (~), but when you have two vectors you can use just a comma.
Also note the order of the vectors within the plot() command and which axes they appear on. The first vector is numeric.vect1 and it appears on the horizontal x-axis.
If you want to label the axes on the plot, you can do this by giving the plot() function values for its optional arguments xlab = and ylab =:
plot(numeric.vect1,   # note again the comma, not a ~
     numeric.vect2,
     xlab="vector1",
     ylab="vector2")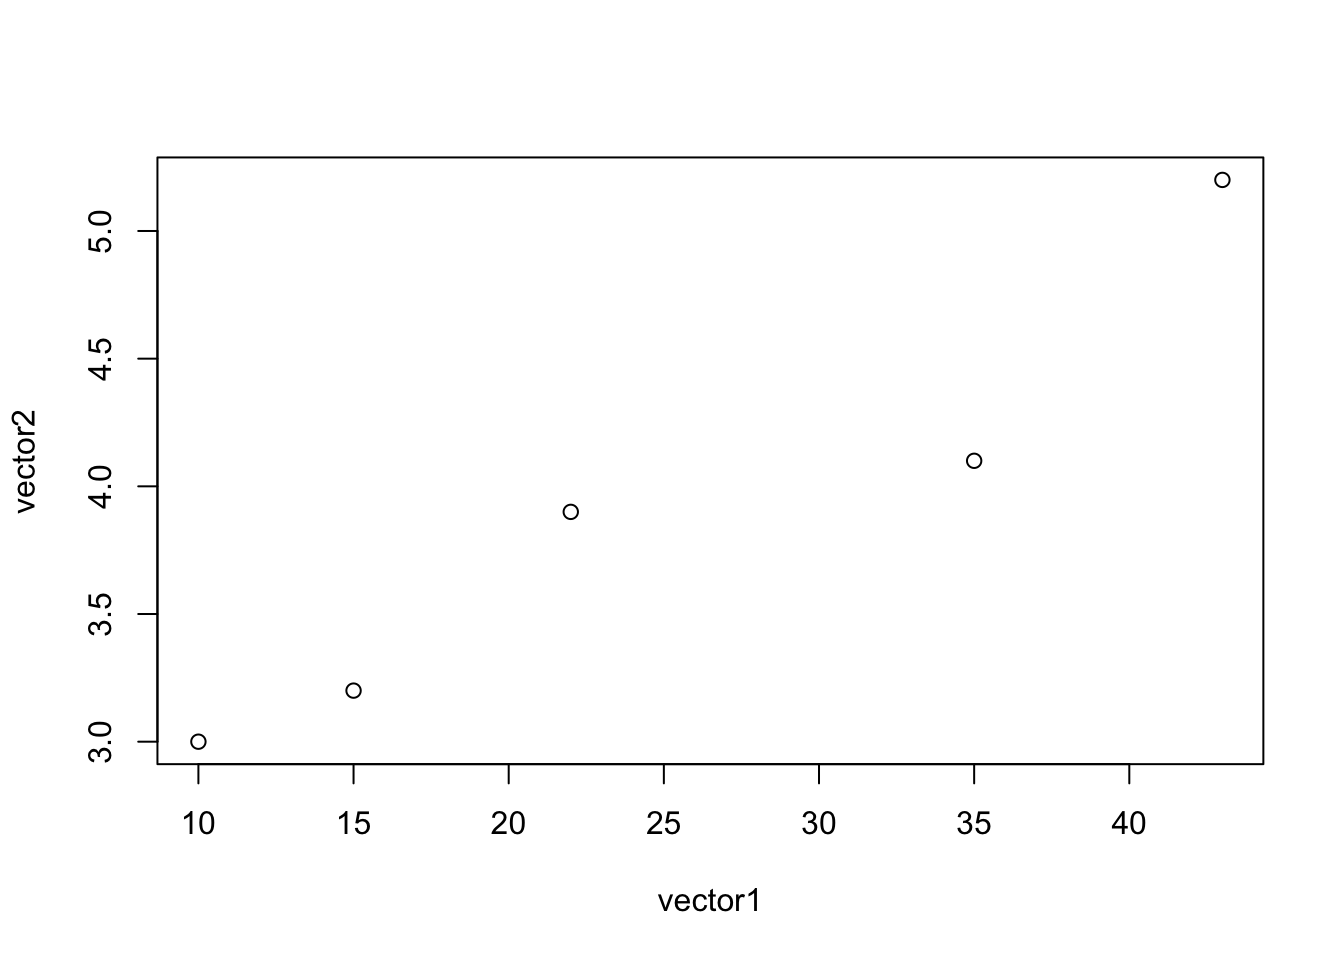
We can store character data in vectors so if we want we could do this to set up our labels:
mylabels <- c("numeric.vect1","numeric.vect2")Then use bracket notation to call the labels from the vector
plot(numeric.vect1,
     numeric.vect2,
     xlab=mylabels[1],
     ylab=mylabels[2])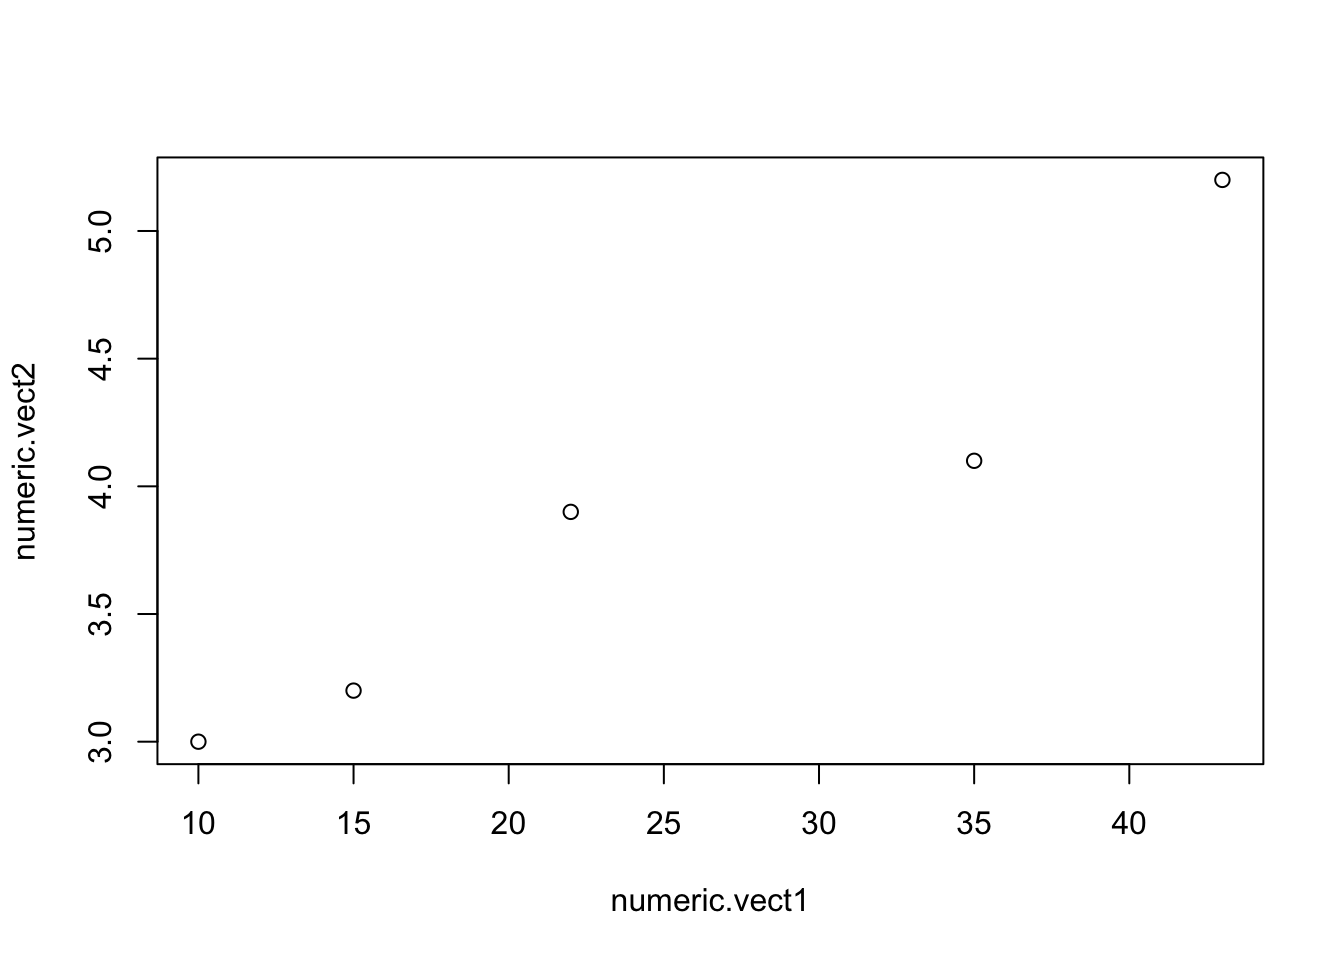
If we want we can use a tilde to make our plot like this:
plot(numeric.vect2 ~ numeric.vect1)
Note that now, numeric.vect2 is on the left and numeric.vect1 is on the right. This flexibility can be tricky to keep track of.
We can also combine these vectors into a dataframe and plot the data by referencing the data frame. First, we combine the two separate vectors into a dataframe using the cbind() command.
df <- cbind(numeric.vect1, numeric.vect2)Then we plot it like this, referencing the dataframe df via the data = ... argument.
plot(numeric.vect2 ~ numeric.vect1, data = df)
8.3 Other plotting packages
Base R has lots of plotting functions; additionally, people have written packages to implement new plotting capabilities. The package ggplot2 is currently the most popular plotting package, and ggpubr is a package which makes ggplot2 easier to use. For quick plots we’ll use base R functions, and when we get to more important things we’ll use ggplot2 and ggpubr.