Ecological Data Science
Preface
I Introduction
1
What is Ecological Data Science & How Will this Book Teach It?
1.1
What is data science?
1.2
Goals
1.3
Approach
1.4
Requirements
1.5
Refereces
1.6
Bibliography
2
What is R and why use it?
2.1
How do we typically use software in science?
2.2
What does R do?
2.3
Why use R
2.4
Who uses it?
2.5
R and computational reproducibility
2.6
Alternatives to R
3
A first encounter with R & RStudio
Vocabulary
R commands
3.1
Getting Started With R and RStudio
3.2
Getting R onto your computer
3.3
Getting RStudio on to your computer
3.4
Getting started with R itself (or not)
3.5
Getting started with RStudio
3.6
Help!
3.7
Other features of RStudio
3.8
Practice (OPTIONAL)
4
The different faces of R code: The console, scripts & RMarkdown
4.1
The console
4.2
Scripts
4.3
Organizing scripts
4.4
RMarkdown
5
RMarkdown
5.1
The “YAML” Header
5.2
Word processing
5.3
Code “chunks”
II Getting Software & Data Into R
6
Loading packages from CRAN
6.1
Introduction
6.2
Loading packages that come with base R
6.3
OPTIONAL: What functions come with base R?
6.4
Optional: What packages come with base R?
6.5
Load data from an external R package
6.6
Optional: Seeing all of your installed packages
6.7
OPTIONAL: Making a plot with ggplot
6.8
Downloading packages using RStudio
6.9
Packages & their dependencies
6.10
Optional: Make a plot with ggpubr
6.11
Challenge
7
Loading data into R from a package
7.1
Introduction
7.2
Data pre-loaded in R
7.3
Loading data from R packages
7.4
Learning about data in R
7.5
Load data from an external R package
7.6
Loading data from an R script
7.7
Challenge
8
Loading packages & data from GitHub
8.1
Introduction
8.2
Accessing GitHub using devtools
8.3
Downloading the wildlifeR package with install_github()
8.4
The wildlifeR packge webiste
9
Loading data from the internet
9.1
Introduction
9.2
Downloading a .csv file using getURL()
9.3
OPTIONAL: Plotting West Virginia Eagle Data
10
Loading data from .csv files into RStudio
10.1
Introduction
10.2
Preliminary step: download a .csv file
10.3
Set the “working directory” (“WD”) in RStudio
10.4
Check the working directory with getwd()
10.5
Check for the file you downloaded with list.files()
10.6
OPTIONAL Interacting with R via the console or the source viewer
10.7
Loading data into R using read.csv()
10.8
Optional: Plot the Mendley 1998 data
10.9
Loading .csv files using RStudio
10.10
Challenge
11
Loading Excel spreadsheets into RStudio
11.1
Preparing a file for loading into R
11.2
Reload data
III Plotting data in R with ggplot2 & friends
12
Review: Loading & Examining Data in R
12.1
Introduction
12.2
Example data for plotting: Fisher’s Irises
12.3
Loading data into R the easy way: pre-made data in an R “Package”
12.4
Load data that is in another R package
12.5
Load Data From A package On CRAN
12.6
Loading packages directly using code
12.7
Troubleshooting Package Downloads
13
Plotting Continous Data in R With ggplot2
13.1
Introduction
13.2
Introduction to ggplot using qplot
13.3
A basic plot in ggplot using qplot()
14
Box plot with labels
14.1
Changing colors in R plots
14.2
Tweaking plots: changing the point size
14.3
Boxplot with qplot
14.4
Basic boxplot with colors
14.5
Basic boxplot lables
14.6
Histograms using qplot
14.7
Modifying histograms: titles with the main = argument
14.8
Challenge: Make a histogram of the mammals data
15
Scatterplots in R Using qplot()
15.1
Introduction
15.2
Scatterplots: 2 Continuous Variables
IV Data analysis: A First Encounter
16
Data Analysis Encounter: Summary Statistics
16.1
Introduction
16.2
Preliminaries
16.3
Getting to know your personalized dataframe
16.4
Summary statistics
16.5
A 1st encounter with dplyr [_]
16.6
dplyr’s group_by() function [_]
16.7
OPTIONAL: Alternatives to dplyr
17
Data analysis encounter: Graphical Data Exploration with Boxplots Using ggpubr
17.1
Introduction
17.2
Data exploration plots
17.3
Challenge: Compare a boxplot and violin plot [_]
18
Data analysis encounter: Plotting means and measures of variation and precision
18.1
Introduction
18.2
Background: measures of variation [_]
18.3
Representing variation with the SD
18.4
Refining plots
19
Data analysis encounter: T-test
References
Published with bookdown
R for Ecological Data Science: A Gentle Introduction
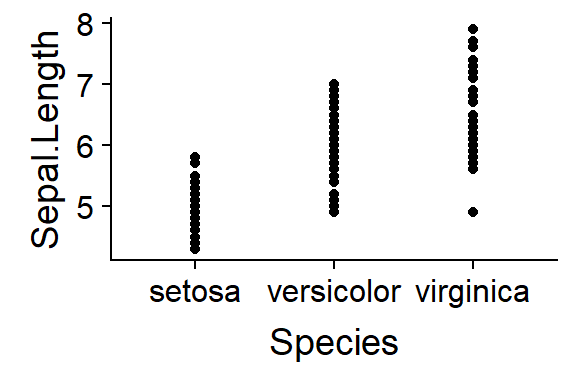
13.3
A basic plot in ggplot using qplot()
Unless you tell it otherwise, qplot plots dots.
qplot
(
y =
Sepal.Length,
x =
Species,
data =
iris)