14.7 Modifying histograms: titles with the main = argument
- Titles are good for your own personal use but actually are almost never used in figures published in papers and books.
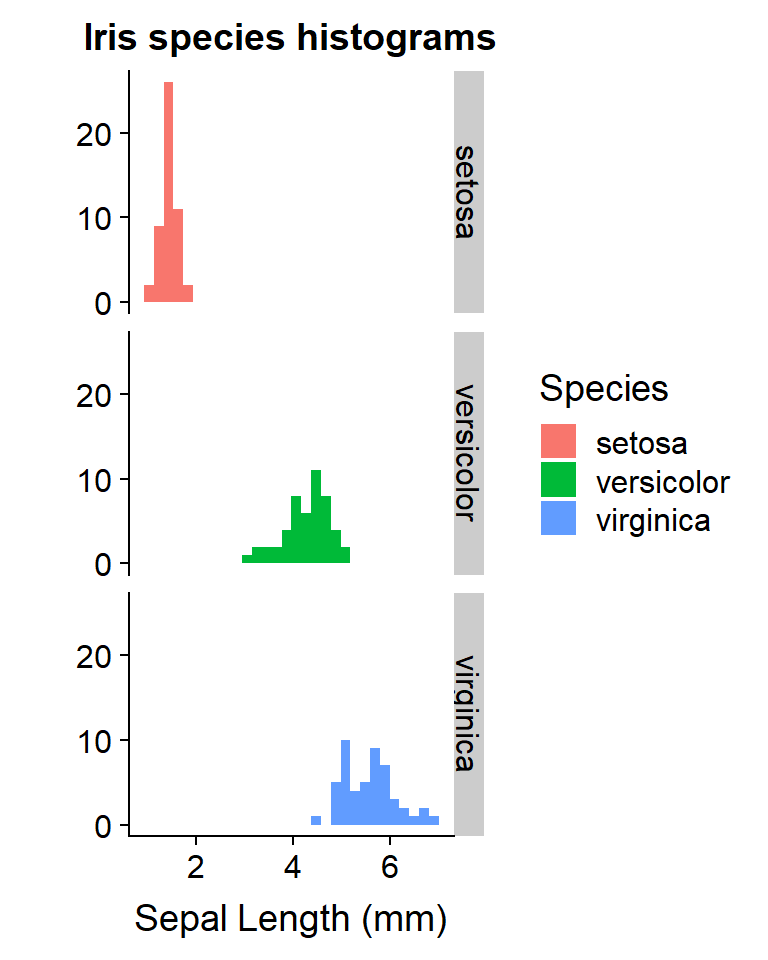
- We can add a title like this using the arguement “main =”
qplot(Petal.Length,
      data = iris,
      fill = Species,
      main = "Iris species histograms",
      facets = Species ~.) +
  xlab ("Sepal Length (mm)")