6.7 OPTIONAL: Making a plot with ggplot
This section is optional
Now we can make a plot with the ggplot2 package we just downloaded, like using the qplot() function. (Note that the syntax is different than what we did above with plot() ).*
qplot(y=FL, x= RW, data = crabs)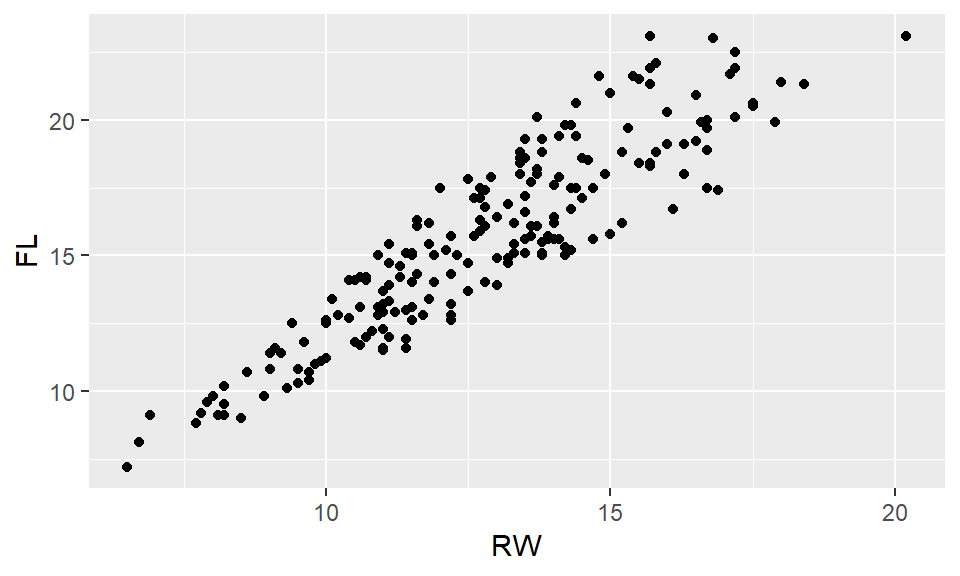
End opitional section