14.1 Changing colors in R plots
14.1.1 Changing colors in R plots part 1
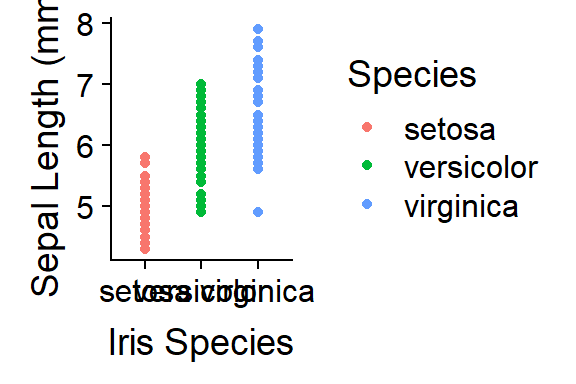
- If we wanted we could change the color of the dots using the argument “col =”. This code can be used to change the color of most types of plots in R.
- This doesn’t increase the information content of the figure but maybe makes it nicer to look at.
qplot(y = Sepal.Length,
      x = Species,
        data = iris,
      color = "red") +
  xlab("Iris Species") +
  ylab ("Sepal Length (mm)" )
14.1.2 Changing colors in R plots part 2
#dopt w/color changes
qplot(y = Sepal.Length,
      x = Species,
        data = iris,
      color = Species) +
  xlab("Iris Species") +
  ylab ("Sepal Length (mm)")