14.6 Histograms using qplot
- made with geom = “histogram” arguement
- very very easy to make in R with ggplot
- very very very hard to make in Excel
- You should make them all the time for you data!
14.6.1 Histograms of iris data
- This code makes a histogram of one of the iris species’ Petal.Length.
- Note that you don’t have “y =” or “x =” for a histogram!
qplot(Petal.Length,
      data = iris)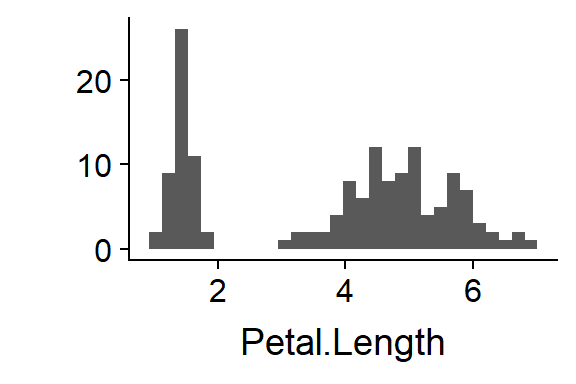
14.6.2 Histogram with colors
What does this show?
qplot(Petal.Length,
      data = iris,
      fill = Species)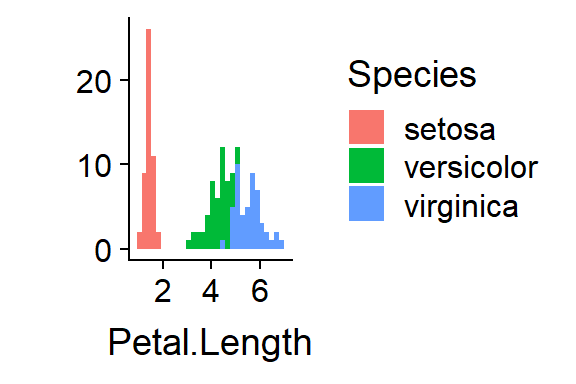
14.6.3 Histogram with axes labels
qplot(Petal.Length,
      data = iris,
      fill = Species) +
  xlab ("Sepal Length (mm)")
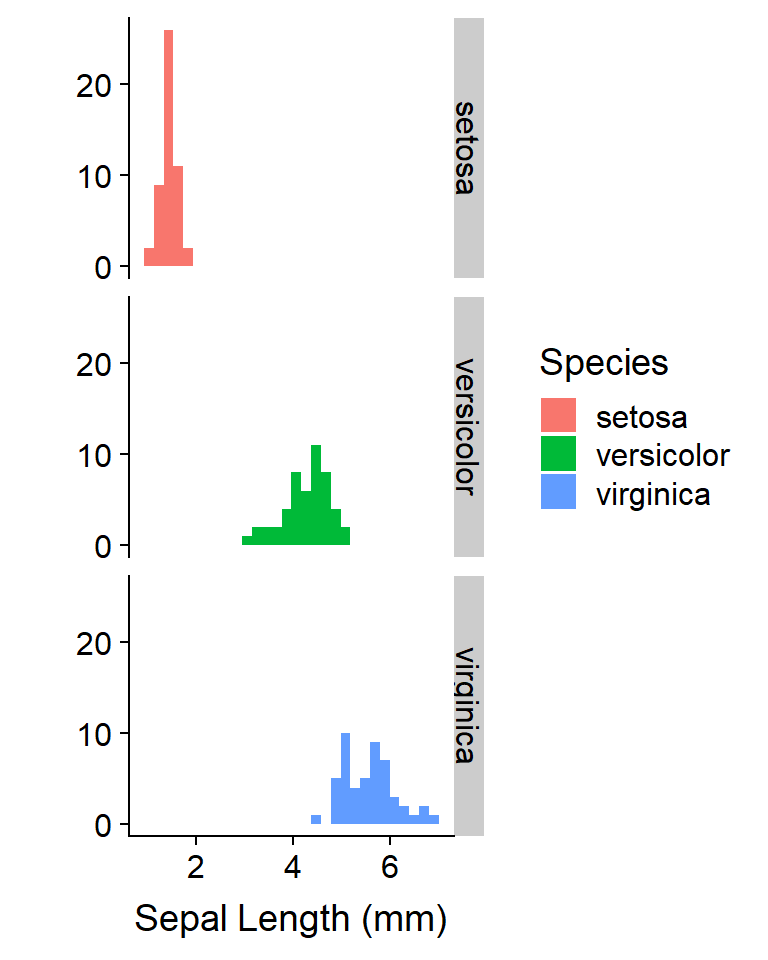
14.6.4 Multiple histograms: “Facets”
What does this show?
qplot(Petal.Length,
      data = iris,
      fill = Species,
facets = Species ~.) 
Add a label to x-axis
qplot(Petal.Length,
      data = iris,
      fill = Species,
      facets = Species ~.) +
  xlab("Sepal Length (mm)")