Chapter 14 Box plot with labels
- R will usually generate labels for the x and y axes based on the command. * These can be changed by adding another command after the qplot() command
- Add The command + xlab(“…”) sets the labels for the x-axis, + ylab(“…”) for the y axis.
- Text for the labels goes in quotes (ie, “Iris species”).
- The use of the “+” is different than for most other R packages
- Forgetting the quotes will cause the code to fail.
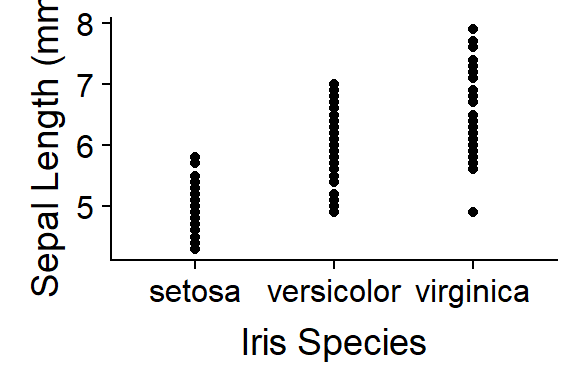
- Note that units (mm) are included for the y axis.
qplot(y = Sepal.Length,
      x = Species,
        data = iris) +         # note the "+"
  xlab("Iris Species") +       # label for x axis
  ylab ("Sepal Length (mm)" )  # label for y axis