6.11 Challenge
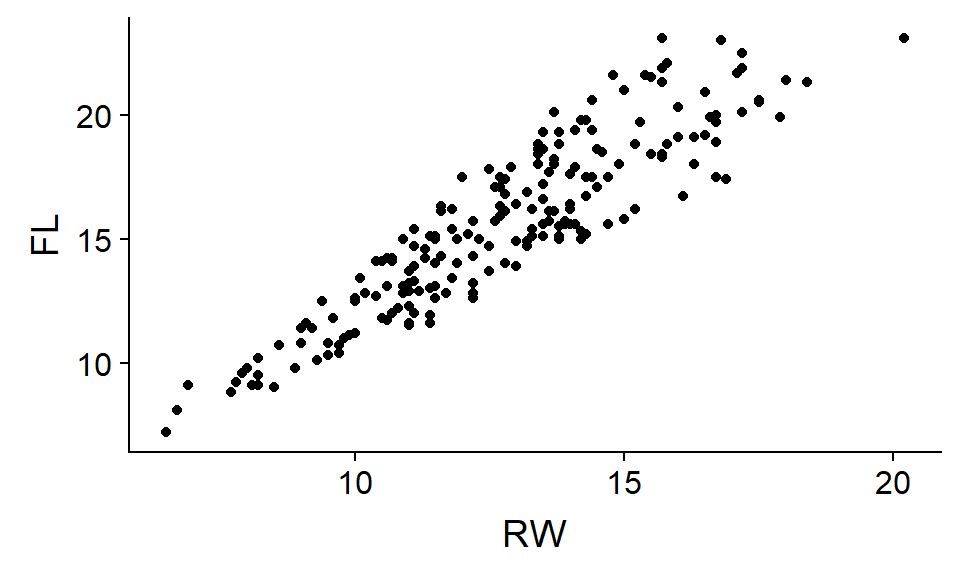
An another add-on to ggplot2 is cowplot, which stands for “Claus O. Wilke Plot”. Download cowplot from CRAN using either the point-and-click method or install.packages, and then load it using library. Then run the following R code, which should make the plot below.
Note that “FL” and “RW” are NOT in quotation marks as they are for ggscatter()!
qplot(data = crabs, y = FL, x = RW) #no quotes!